Related: Core Web Vitals and Lighthouse Explained INP is the Core Web Vital that Long Tasks directly destroy.
A Long Task is any main-thread task that runs for more than 50ms without yielding. During that window, the browser cannot process user input, paint frames, or run scheduled animations. To the user, the UI is frozen.
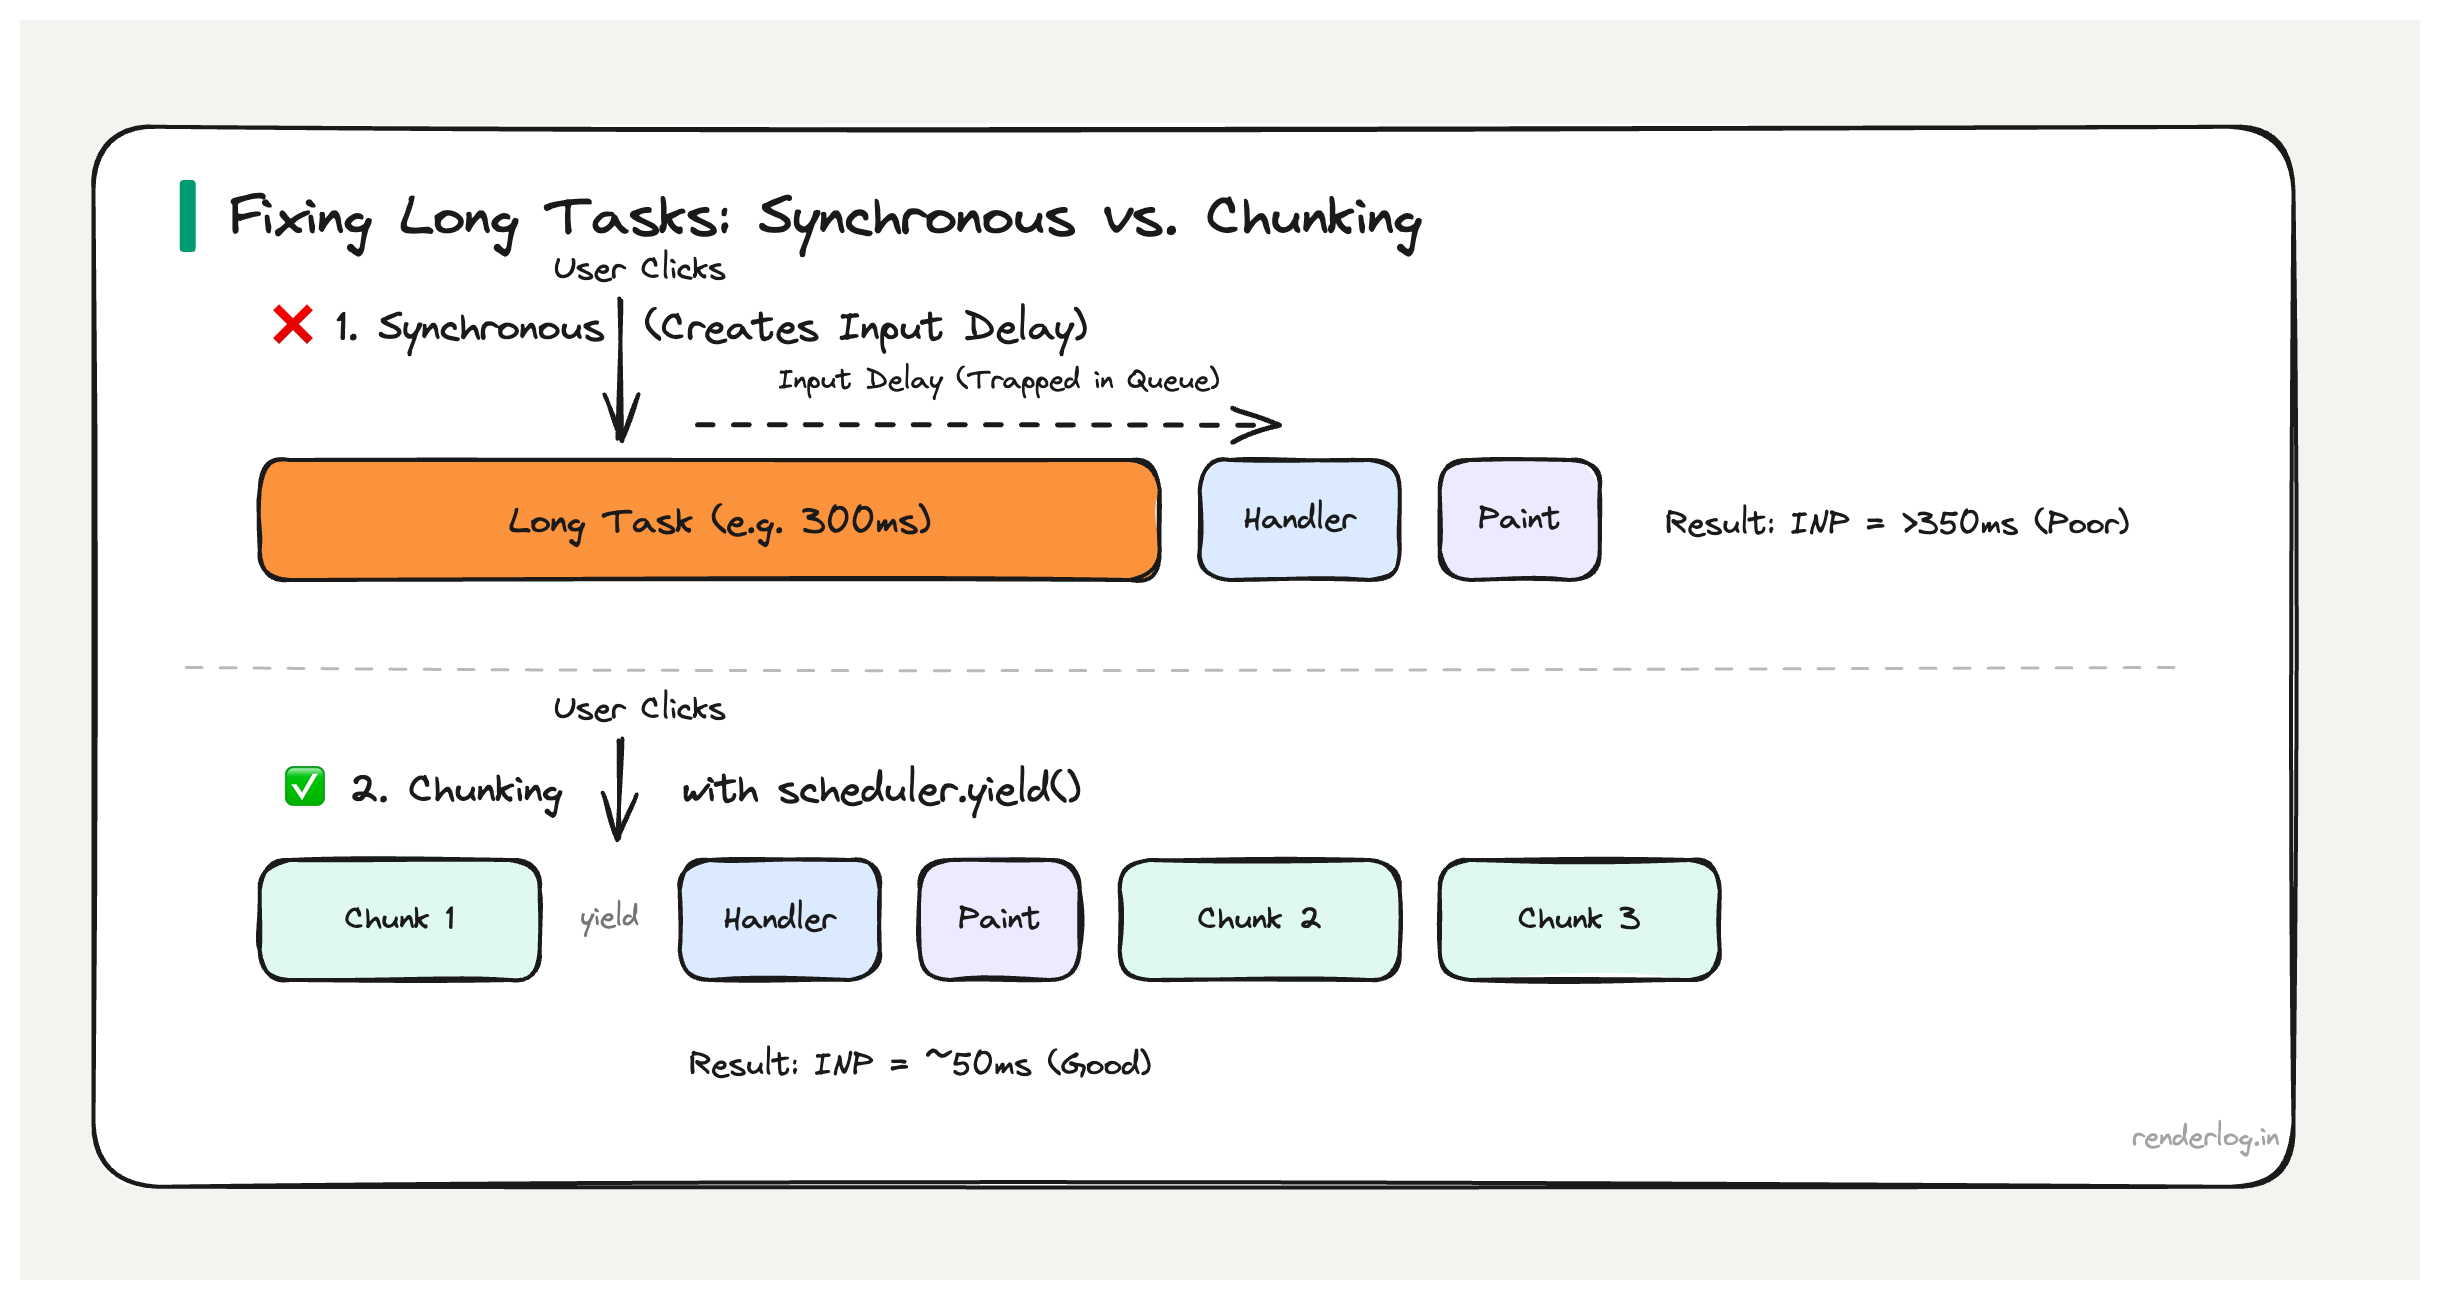
Why 50ms matters: The RAIL model’s 100ms response budget leaves ~50ms for JavaScript before the user perceives a lag. Long Tasks directly cause INP regressions — if a Long Task is running when the user clicks, that click waits in the queue until the task finishes. A 300ms Long Task means 300ms of input delay before your event handler even starts.
What this covers: How to observe Long Tasks in production, why they destroy INP, what causes them, and how to break them up using scheduler.yield(), postTask(), and Web Workers.
What is a Long Task
A Long Task is any task that runs on the browser’s main thread for more than 50 milliseconds without yielding. The 50ms threshold comes from the RAIL model (Response, Animation, Idle, Load) specifically from the observation that humans perceive interactions as instantaneous if the response comes within 100ms of their input.
If you want to leave room for the browser to do its own work (rendering, garbage collection) and guarantee a response within 100ms, you have roughly 50ms of budget for your JavaScript to run before you need to yield control back to the browser. Hence 50ms is the Long Task boundary.
During a Long Task, the browser cannot do anything else on the main thread. It cannot process user input. It cannot run scheduled animations. It cannot paint. The UI is effectively frozen from the user’s perspective.
The browser doesn’t stop the task JavaScript is single-threaded and runs to completion unless you explicitly yield. A 500ms synchronous operation will block everything for the full 500ms with no way out.
The PerformanceLongTaskTiming API
You can observe Long Tasks in production using the PerformanceLongTaskTiming API through PerformanceObserver. This works in all modern browsers and can be used to log Long Tasks to your analytics infrastructure.
// Observe Long Tasks in production
const observer = new PerformanceObserver(list => {
  for (const entry of list.getEntries()) {
    // entry.duration is the task length in ms
    if (entry.duration > 50) {
      console.log(`Long task: ${entry.duration.toFixed(1)}ms`);

      // entry.attribution tells you which script was responsible
      entry.attribution.forEach(attr => {
        console.log('  Script:', attr.name || attr.containerSrc);
        console.log('  Container:', attr.containerType); // 'iframe', 'embed', 'object', or ''
      });

      // Send to your analytics
      sendToAnalytics({
        type: 'long-task',
        duration: entry.duration,
        startTime: entry.startTime,
      });
    }
  }
});

observer.observe({ type: 'longtask', buffered: true });
In production, aggregating this data tells you which pages have the worst Long Task profiles and which third-party scripts are the main contributors.
One limitation: attribution is high-level. It tells you the containing script URL but not the specific function. For that, you need the Performance panel’s flame chart during development, or user timing marks (see below).
Why Long Tasks destroy INP
INP’s input delay component the time between a user’s input event and when the browser begins processing event handlers is caused almost entirely by Long Tasks. Here’s why.
When a user clicks a button, the browser queues an input event. But if the main thread is currently in the middle of executing a Long Task, that event sits in the queue until the task finishes. If the Long Task takes 300ms, the input event has 300ms of input delay before any of your handler code even starts.
User clicks button
   │
   ▼
[=======  Long Task (300ms)  =======]   ← Main thread is here
                                    │
                                    ▼
                              Input event starts processing
                                    │
                                    ▼
                              [Event handler runs (50ms)]
                                    │
                                    ▼
                              Browser paints new state
                                    │
                              INP = 350ms (poor)
Even if your event handler is fast, the Long Task before it has already blown your INP budget. This is the direct mechanism: Long Tasks create input delay, input delay is the largest component of bad INP.
What causes Long Tasks
Long Tasks come from a range of sources. The ones I see most often in real apps:
| Source | Why it creates a Long Task |
|---|---|
| Large JSON.parse() | Parsing is synchronous, runs to completion 10MB JSON can take 200ms |
| Heavy React renders | Synchronous reconciliation of large trees; React 18 concurrent mode helps but doesn’t auto-fix |
| Synchronous XHR | Blocks the main thread entirely for the full request duration |
| Third-party scripts | Analytics, chat widgets, A/B testing tools often poorly optimized |
| Array operations on large datasets | .filter(), .sort(), .map() on thousands of items |
| Image decoding | Large images decoded synchronously on the main thread (use decoding="async") |
| Bundled library initialization | Heavy moment.js locale loading, large data tables initializing |
Third-party scripts deserve special attention. They run in your page’s main thread (unless in an <iframe>), they’re not under your control, and they’re routinely responsible for the worst Long Tasks on production sites. The Long Task attribution API often reveals that 80% of blocking time comes from a single analytics or chat script.
Finding Long Tasks in DevTools
In the Chrome Performance panel, Long Tasks appear as grey blocks with a red diagonal triangle in the top-right corner. The red triangle is the browser’s flag: “this task took too long.”
User timing marks are the most effective way to correlate Long Tasks with your application’s logic:
// Wrap suspicious operations with performance marks
function processLargeDataset(data) {
  performance.mark('processDataset-start');

  const result = data
    .filter(item => item.active)
    .sort((a, b) => b.score - a.score)
    .slice(0, 100);

  performance.mark('processDataset-end');
  performance.measure('processDataset', 'processDataset-start', 'processDataset-end');

  return result;
}
These marks show up as labeled bars in the Performance panel’s “Timings” row, directly aligned with the main thread flame chart. You can see exactly which of your functions corresponds to which Long Task.
Breaking up Long Tasks: the strategies
This is where the options get interesting. There are several different approaches to yielding, each with different tradeoffs.
setTimeout(fn, 0) the original yield
The oldest approach: wrap work in setTimeout(fn, 0) to defer it to the next task. The browser can process input events between tasks.
// Processing 10,000 items  do it in chunks
function processInChunks(items, chunkSize = 1000) {
  let index = 0;

  function processChunk() {
    const end = Math.min(index + chunkSize, items.length);
    for (let i = index; i < end; i++) {
      processItem(items[i]);
    }
    index = end;

    if (index < items.length) {
      setTimeout(processChunk, 0); // Yield and continue
    }
  }

  processChunk();
}
setTimeout(fn, 0) has a 4ms minimum delay enforced by browsers (after 5 nested setTimeouts). It works, but it’s not prioritized your chunk goes to the back of the task queue, after all pending macrotasks including timers from other scripts.
scheduler.yield() the modern way
scheduler.yield() is a newer API designed specifically for this pattern. It yields to the browser, but then resumes your function with higher priority than other queued work, specifically to continue an in-progress user-initiated task.
async function processInChunks(items) {
  for (let i = 0; i < items.length; i++) {
    processItem(items[i]);

    // Yield every 100 items to let the browser breathe
    if (i % 100 === 0) {
      await scheduler.yield();
    }
  }
}
This is strictly better than setTimeout(fn, 0) for user-initiated work because the continuation is deprioritized just enough to let input events through, but reprioritized before background tasks so the work finishes promptly.
scheduler.postTask() explicit priority
scheduler.postTask() lets you schedule work with explicit priority levels, giving the browser a richer signal about how to order tasks.
// User-blocking: highest priority, delays to avoid input delay
const result = await scheduler.postTask(() => criticalUiUpdate(), {
  priority: 'user-blocking',
});

// User-visible: medium priority, normal non-urgent UI work
await scheduler.postTask(() => updateSecondaryPanel(), {
  priority: 'user-visible',
});

// Background: lowest priority, yields to everything else
await scheduler.postTask(() => prefetchRelatedContent(), {
  priority: 'background',
});
The priority levels map to specific concepts:
| Priority | Use case |
|---|---|
user-blocking | Work that directly blocks what the user is trying to do right now |
user-visible | Work that affects what the user can see, but not immediately critical |
background | Analytics, prefetch, non-visible data processing |
isInputPending() don’t yield unnecessarily
navigator.scheduling.isInputPending() lets you check if there are pending input events before deciding whether to yield. This avoids the overhead of yielding when no user is waiting.
async function processWithInputCheck(items) {
  for (let i = 0; i < items.length; i++) {
    processItem(items[i]);

    // Only yield if the user is actually waiting for something
    if (i % 50 === 0 && navigator.scheduling?.isInputPending()) {
      await scheduler.yield();
    }
  }
}
This is an optimization on top of chunking you process work as fast as possible when the user isn’t interacting, but immediately yield when they are.
Web Workers for CPU-heavy work
If the work doesn’t need to touch the DOM, Web Workers are the right tool. They run in a separate thread entirely, so they don’t block the main thread at all.
// worker.js
self.onmessage = function(e) {
  const { items } = e.data;

  // Heavy computation runs in a separate thread
  const result = items
    .filter(item => complexFilter(item))
    .sort(complexSort)
    .map(transform);

  self.postMessage({ result });
};
// main.js
const worker = new Worker('/worker.js');

worker.postMessage({ items: largeDataset });

worker.onmessage = function(e) {
  // Main thread only receives the result  no blocking occurred
  updateUI(e.data.result);
};
The limitation is serialization: data passed between the main thread and worker is serialized (structured clone algorithm). For very large datasets, this serialization cost itself can become significant. Use SharedArrayBuffer or Transferable objects for high-frequency data passing.
async/await doesn’t automatically prevent Long Tasks
This is the most common misconception I encounter. Developers often assume that because their code is async/await, it’s “non-blocking.” It’s not.
async/await only yields at await points. Between those points, the code runs synchronously on the main thread. If the code between two await expressions takes 300ms, that’s a 300ms Long Task.
async function fetchAndProcess() {
  const data = await fetch('/api/data').then(r => r.json()); // Yields here (network)

  // ⚠️ This next line runs synchronously. If data is large, this is a Long Task.
  const processed = data.items.flatMap(item => complexTransform(item));

  await updateDatabase(processed); // Yields here (async operation)
}
The await fetch yields (the network request happens off the main thread). But the .flatMap() call in between is synchronous JavaScript running on the main thread. If data.items has 50,000 entries and complexTransform is not trivial, you’ve just created a Long Task even though the function is async.
The fix is to either chunk the synchronous processing or move it to a Web Worker.
Total Blocking Time and Long Tasks
Total Blocking Time (TBT) is a Lighthouse metric that correlates with Long Tasks. For each Long Task, TBT counts only the portion that exceeds 50ms as “blocking time.” A 200ms Long Task contributes 150ms to TBT.
TBT is calculated only during page load (between First Contentful Paint and Time to Interactive), so it doesn’t capture Long Tasks that occur during user interactions after load. But it’s a useful proxy for “how much blocking work happens on this page during load” and correlates reasonably with INP for load-time interactions.
| Long Task Duration | Contribution to TBT |
|---|---|
| 40ms | 0ms (under threshold) |
| 60ms | 10ms |
| 150ms | 100ms |
| 500ms | 450ms |
If your Lighthouse TBT is high (over 300ms is “poor”), you have Long Tasks during load that are worth investigating.
The complete mental model
Long Tasks are a symptom of treating the browser’s single main thread as if it has unlimited time. It doesn’t it needs to service input events, render frames, and run your code all within the same thread.
The discipline is:
- Measure first use
PerformanceLongTaskTimingin production to know where your worst Long Tasks are, not just guess. - Identify the cause is it your code or a third-party? Is it a large computation, a large render, or large data parsing?
- Choose the right tool
scheduler.yield()for user-initiated chunking,scheduler.postTask()for prioritized background work, Web Workers for anything that doesn’t touch the DOM. - Validate the fix record a Performance trace before and after. Long Tasks should be gone or reduced below 50ms. INP in production should improve within 28 days as CrUX data updates.
The goal isn’t zero Long Tasks forever it’s ensuring that no Long Task is running when a user is trying to interact with your page.