Related: Browser Rendering Pipeline: the underlying mechanics that most of these metrics are actually measuring.
LCP, CLS, INP, TTFB — the Core Web Vitals are precise technical measurements, not vague UX impressions. Each one captures a specific failure mode: slow resource loading, visual instability, interaction lag, server latency. Understanding what each metric measures at the spec level, and why Lighthouse lab scores diverge dramatically from real-user CrUX data, is what separates diagnosing actual regressions from chasing synthetic numbers.
What this covers: The technical definition and measurement mechanics of each Core Web Vital, why lab and field data diverge, why a perfect Lighthouse score coexists with terrible INP, and the exact debugging workflow for each metric.
LCP: Largest Contentful Paint
Largest Contentful Paint measures the time from when the page starts loading to when the largest content element in the viewport is rendered. “Largest” is determined by the element’s rendered size in the viewport, not its intrinsic size, not its file size.
Which elements qualify
Not everything counts as an LCP candidate. The spec is specific:
| Element type | Qualifies? |
|---|---|
<img> elements | Yes |
<image> inside SVG | Yes |
<video> poster image | Yes |
CSS background-image | Yes (as of recent spec updates) |
| Block-level elements with text | Yes |
| Inline elements | No |
| SVG shapes | No |
The LCP candidate is updated as new elements render and become visible. If your page progressively reveals content (skeleton screen, then hero image, then content below the fold), the LCP timestamp updates each time a larger element renders. The final LCP value is the last update before the user first interacts with the page (scroll, click, or keypress stops LCP measurement).
Why images and text blocks differ
An image LCP depends on network fetch time the browser has to download the image before it can paint it. A text block LCP depends only on CSS and font availability, which is usually much faster. This is why a page with a large hero image almost always has worse LCP than a text-heavy landing page of equivalent visual weight.
The most common LCP problem I see: a hero image that loads fast on a Lighthouse test (simulated throttled connection, nearby CDN edge) but loads in 5+ seconds for users on mobile in Southeast Asia because the image isn’t on a CDN node close to them, or worse, it’s not being served with proper Cache-Control headers and gets fetched fresh every visit.
What invalidates LCP
LCP measurement stops at the first user interaction. This is intentional once a user starts scrolling or clicking, the “initial load” is considered complete. This means that if your largest element loads just after a user’s first touch, it won’t be counted as LCP, which can make synthetic measurements look better than real experience.
CLS: Cumulative Layout Shift
Cumulative Layout Shift measures visual instability: how much page content shifts around unexpectedly after it first renders. The score is a unitless number calculated from a formula that captures both how much of the viewport shifted and how far elements moved.
The formula
The score for each individual layout shift is:
layout shift score = impact fraction × distance fraction
Impact fraction is the fraction of the viewport that was affected by unstable elements during the shift. If an element occupies 50% of the viewport and moves, the impact fraction is at least 0.5.
Distance fraction is how far the element moved, as a fraction of the viewport’s largest dimension. An element that moves 100px on a 800px viewport has a distance fraction of 0.125.
So an element that occupies half the screen and moves 20% of the viewport height gives a shift score of 0.5 × 0.2 = 0.1 right at the “needs improvement” boundary.
CLS is cumulative all individual layout shift scores are added together, with a windowing algorithm that groups shifts within 5 seconds of each other (session windows). The final CLS is the score of the worst session window.
What causes CLS
The most common offenders I’ve encountered:
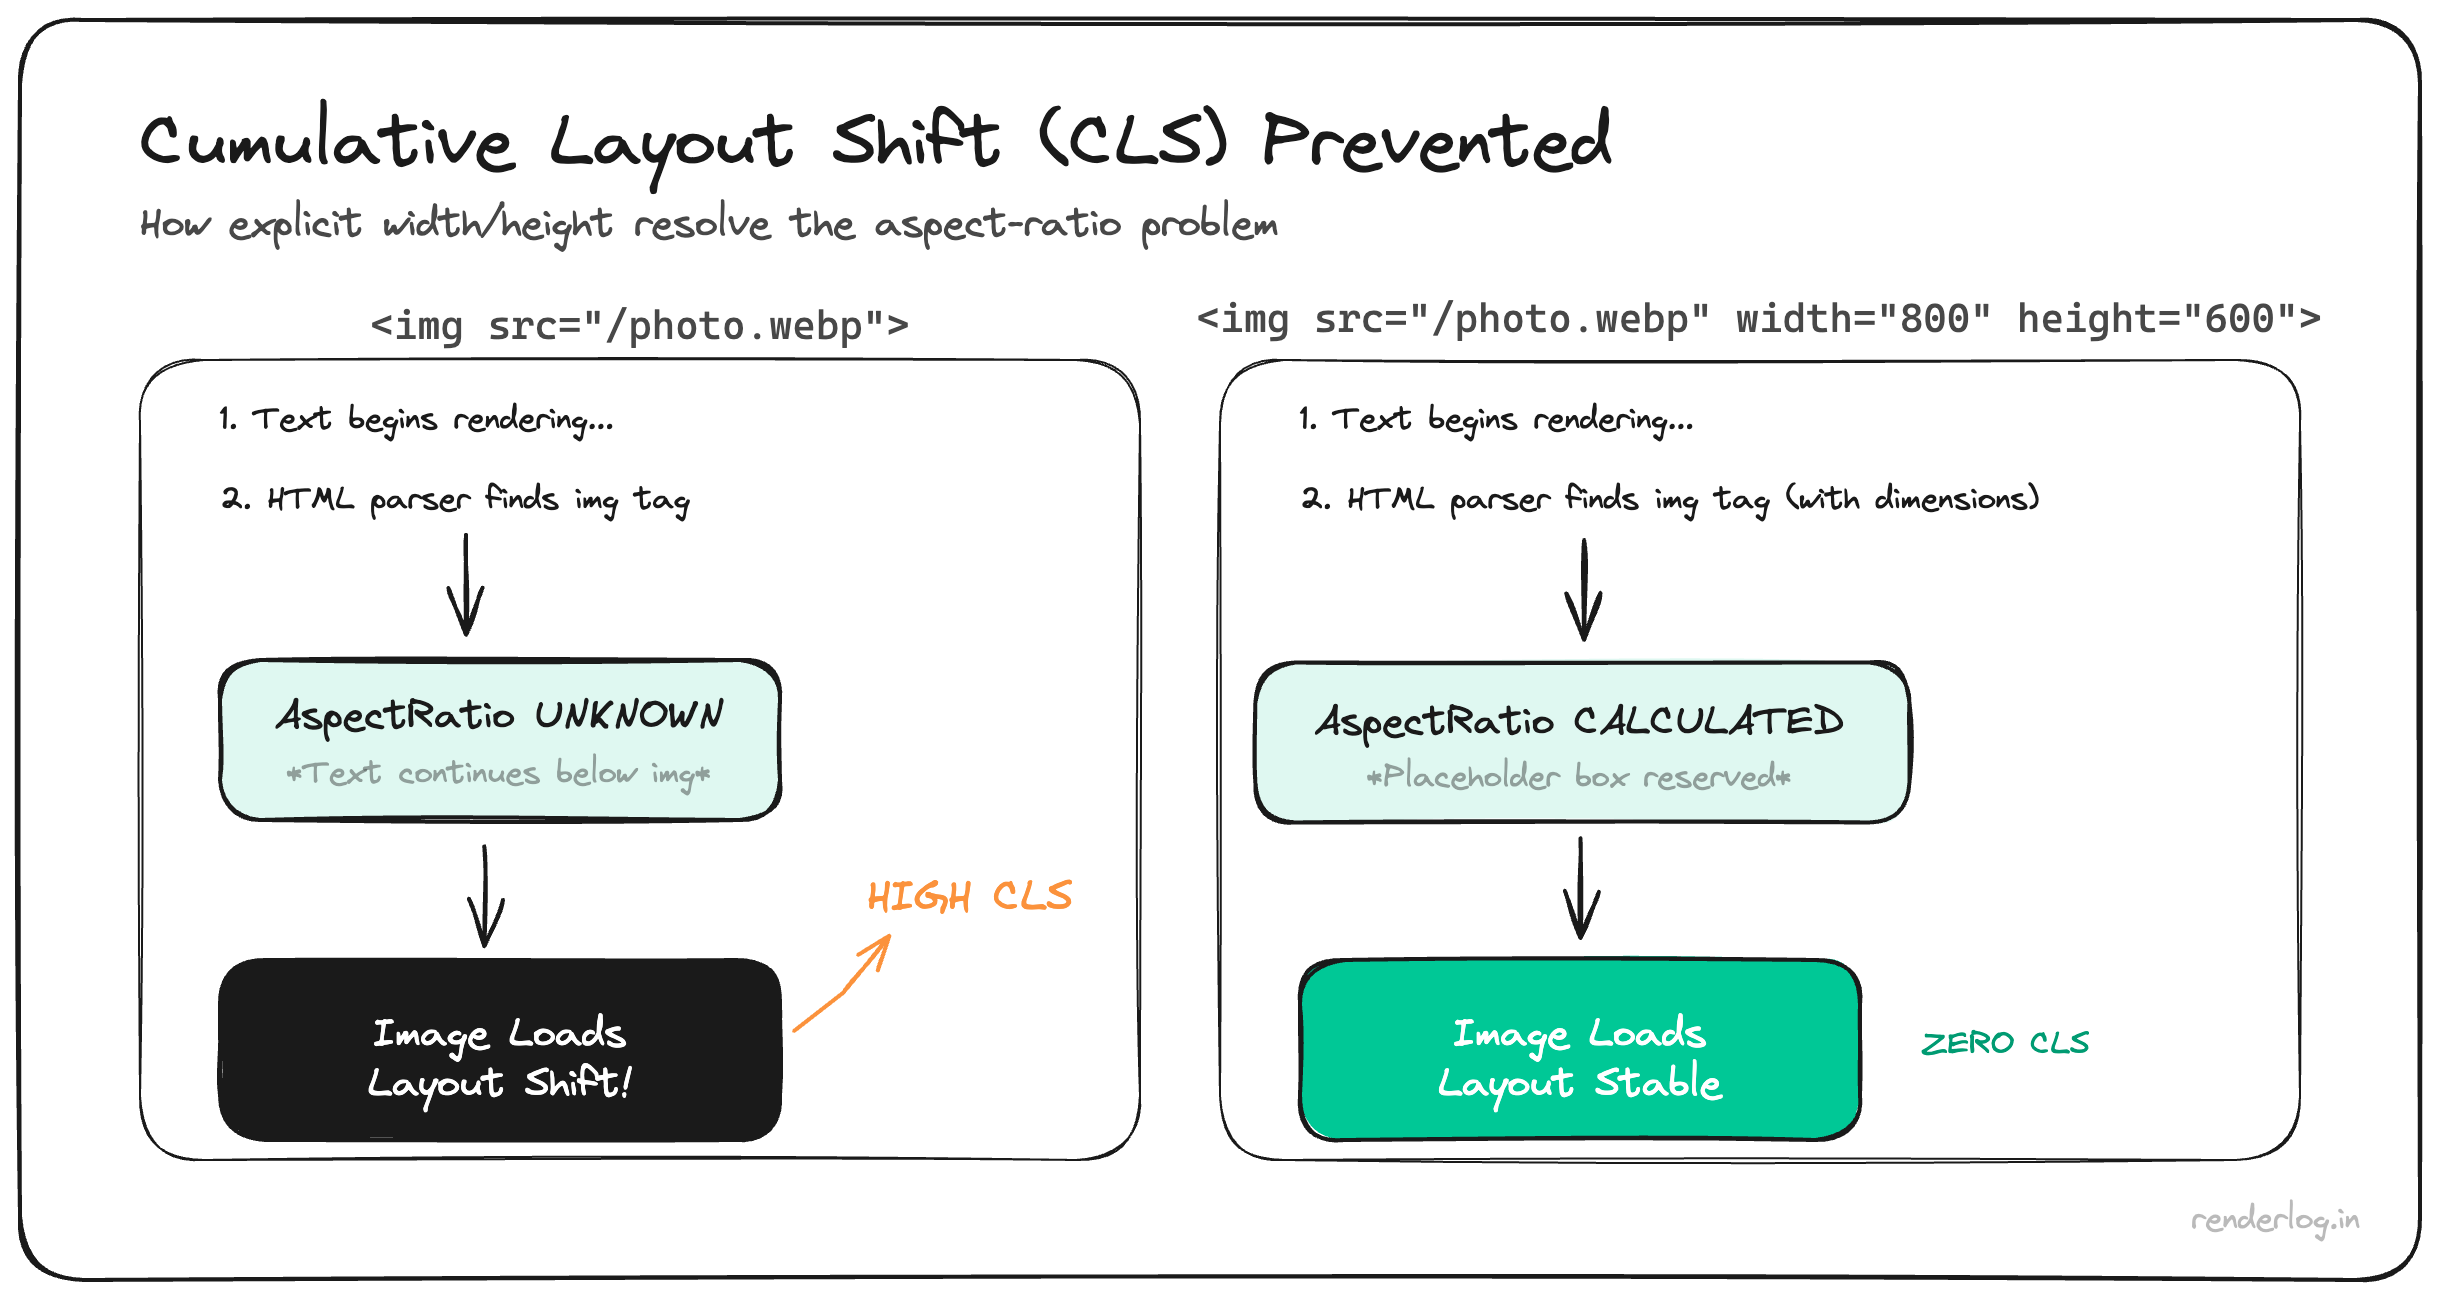
Images without explicit dimensions. When the browser doesn’t know the aspect ratio of an image before it loads, it allocates zero space for it. When the image arrives, everything below it jumps.
<!-- Bad: no dimensions, causes layout shift when image loads -->
<img src="/hero.jpg" alt="Hero">

<!-- Good: aspect ratio known upfront -->
<img src="/hero.jpg" alt="Hero" width="1200" height="630">
Dynamic content injection. A cookie banner, notification bar, or ad that gets inserted above existing content after the page loads will shift everything below it.
Web fonts causing FOUT. When a custom font loads and replaces the fallback font, if the two fonts have different metrics (line height, character width), text reflows. This is the “flash of unstyled text” causing layout shifts.
/* Mitigates font-swap shifts by matching fallback metrics */
@font-face {
  font-family: 'MyFont';
  src: url('/fonts/myfont.woff2') format('woff2');
  font-display: optional; /* Don't swap if font isn't ready, no shift */
}
Debugging CLS
The web-vitals library reports which elements shifted:
import { onCLS } from 'web-vitals';

onCLS(metric => {
  metric.entries.forEach(entry => {
    console.log('Shifted elements:', entry.sources);
    // sources contains element references and rects
  });
});
Chrome DevTools also has a “Layout Shift Regions” overlay under Rendering → Layout Shift Regions. Blue flashes show exactly which elements are shifting. This makes diagnosis extremely fast once you know it exists.
INP: Interaction to Next Paint
Interaction to Next Paint replaced First Input Delay (FID) as a Core Web Vital in March 2024. Understanding why requires understanding what was wrong with FID.
Why FID was replaced
FID measured only the input delay component of the first interaction on a page: the time from when the user first clicks/taps/presses to when the browser starts processing the event. This had two problems:
- It measured only the first interaction, which is often before heavy JavaScript has fully loaded. Many apps had good FID but terrible interactivity for subsequent clicks.
- It measured only input delay, not the full interaction duration. Even if the browser started processing immediately, if the event handler took 400ms, FID would show 0ms and consider it a success.
How INP works
INP measures the full latency of all interactions throughout the page visit: click, tap, and keyboard events. For each interaction, it measures the time from user input to the browser’s next paint after processing. The INP score is the worst interaction observed during the page visit (with some statistical smoothing: specifically, it’s the 98th percentile if there are many interactions, to avoid outliers from accidental double-clicks).
An interaction’s latency has three components:
interaction latency = input delay + processing time + presentation delay
- Input delay: time from input event to when the browser starts running event handlers. Caused by long tasks blocking the main thread.
- Processing time: how long the event handlers themselves take to run.
- Presentation delay: time for the browser to render and paint after handlers complete.
INP targets: under 200ms is “good”, 200–500ms “needs improvement”, over 500ms is “poor.”
What “next paint” means
The “next paint” in INP is the first frame the browser can render after the event has been fully processed. This means the browser has to complete layout and paint, not just run the JavaScript. A handler that does setState() in React and triggers a massive re-render contributes all of that re-render time to INP.
This is why INP is a much more honest signal than FID. A click that triggers a 600ms React reconciliation will show up as a 600ms INP, not a 0ms FID.
TTFB: Time to First Byte
Time to First Byte measures the time from when the browser starts the navigation request to when it receives the first byte of the response. It’s a server + network metric.
What TTFB captures: server processing time (your Next.js SSR, your database query), DNS lookup, TCP connection, TLS handshake, and network transit.
What TTFB does not capture: anything that happens after the server starts streaming. A server that starts streaming HTML in 100ms but spends another 2 seconds building the response will look fast in TTFB but still deliver a slow page.
TTFB targets: under 800ms is “good.” This sounds loose, but global users on mobile networks with high latency to your origin can easily exceed this even if your server responds in 10ms, purely from network round trips.
Lab vs field data: why they diverge
This is the thing that burned us. Lab data (Lighthouse, WebPageTest) runs in a controlled environment: a fixed device emulation, a fixed network speed, a server physically close to the testing infrastructure, and no real user behavior.
Field data comes from real users. Google’s CrUX (Chrome User Experience Report) collects performance metrics from Chrome users who have opted in to usage statistics. PageSpeed Insights shows you CrUX data for your URL when it exists (it needs enough visits to have a statistically meaningful sample).
| Dimension | Lab (Lighthouse) | Field (CrUX) |
|---|---|---|
| Device | Emulated mid-range Android | Real user devices |
| Network | Fixed throttled (4G simulation) | Real network conditions |
| Geography | One location | All user locations |
| User behavior | No interactions | Real clicks, scrolls, navigation |
| Latency to CDN | Often very low | Varies by user |
| Data freshness | Instant | 28-day rolling window |
The 28-day rolling window is particularly important. If you deployed a performance regression two weeks ago, it’s baked into your CrUX data. If you fixed it yesterday, the improvement won’t show up in Search Console for weeks.
The 75th percentile rule
Google doesn’t use your average Core Web Vitals score to determine your Search Console assessment. They use the 75th percentile of field data: the value that 75% of your page loads achieve or better.
This matters enormously for INP. If 74% of your users have an INP under 200ms but 26% have an INP over 800ms (perhaps mobile users on slow devices running your heavy React app), your 75th percentile INP is over 200ms and you’re not in the “good” zone even though most users are fine.
This is by design. Google wants the score to reflect the experience of the bottom quartile of your users, not the median or average.
Why a perfect Lighthouse score coexists with terrible INP
This was the most confusing part for our team to accept. Here’s how it happens:
Lighthouse runs with no user interactions beyond the page load. INP requires interactions. Lighthouse doesn’t measure INP from actual clicks because there are no clicks in a lab test it estimates it from Total Blocking Time (TBT) and long tasks during load. This estimate can be wildly off.
Our app had minimal load-time blocking: we code-split aggressively, deferred everything non-critical. Lighthouse loved it. But after hydration, when users actually clicked, our React event handlers triggered enormous re-renders. INP was 740ms in the field because we were doing 400ms of synchronous reconciliation on every button click. Lighthouse never saw this.
How to actually measure each metric
Don’t rely only on Lighthouse. Use a layered approach:
import { onLCP, onCLS, onINP, onTTFB } from 'web-vitals';

// Report all Core Web Vitals to your analytics
function sendToAnalytics(metric) {
  const body = {
    name: metric.name,
    value: metric.value,
    rating: metric.rating, // 'good', 'needs-improvement', 'poor'
    delta: metric.delta,
    id: metric.id,
    navigationType: metric.navigationType,
  };

  // Use sendBeacon so it fires even when page is unloading
  navigator.sendBeacon('/analytics', JSON.stringify(body));
}

onLCP(sendToAnalytics);
onCLS(sendToAnalytics);
onINP(sendToAnalytics);
onTTFB(sendToAnalytics);
You can also observe INP directly using PerformanceObserver if you want to capture interaction-level detail:
const observer = new PerformanceObserver(list => {
  for (const entry of list.getEntries()) {
    if (entry.duration > 200) {
      // Capture slow interactions with the element that was clicked
      console.log('Slow interaction:', {
        duration: entry.duration,
        type: entry.name, // 'click', 'keydown', etc.
        target: entry.target,
        startTime: entry.startTime,
      });
    }
  }
});

observer.observe({ type: 'event', buffered: true, durationThreshold: 16 });
The tools and what they’re good for:
| Tool | Data type | Best for |
|---|---|---|
| Lighthouse (DevTools) | Lab | Quick feedback during development |
| PageSpeed Insights | Lab + Field | Checking real user CrUX data |
| Search Console Core Web Vitals | Field | 28-day trend, page-group analysis |
| web-vitals JS library | Field (real users) | Sending to your own analytics |
| PerformanceObserver | Field (real users) | Detailed interaction diagnostics |
| WebPageTest | Lab (multi-location) | Geographic testing, filmstrip |
Practical debugging workflow
For LCP problems: open the Network panel, filter by Img, find your hero image. Check: is it preloaded? Is it on a CDN? Is it in WebP/AVIF format? Then open the Performance panel and look for the LCP marker. It shows you exactly which element was measured and when it rendered relative to navigation start.
For CLS problems: enable Layout Shift Regions in DevTools → Rendering. Then use onCLS from web-vitals with the entries.sources to identify the specific elements. Add explicit width and height to all images. Use font-display: optional or size-adjusted fallback fonts.
For INP problems: record a Performance trace while clicking the button that feels slow. Look for long yellow JavaScript blocks in the main thread after your click. The call stack will show you exactly which function is taking 400ms. Then read the next post in this series on Long Tasks.
For TTFB problems: use WebPageTest’s “Connection View” to see how much time is DNS, TCP, TLS, and server wait. If server wait is high, look at your SSR code, database queries, and edge caching configuration.
The scores in Search Console are the destination. The tools above are how you navigate there.