Related: The 16.6ms Frame Budget, the wall clock deadline that every stage in this pipeline must fit inside.
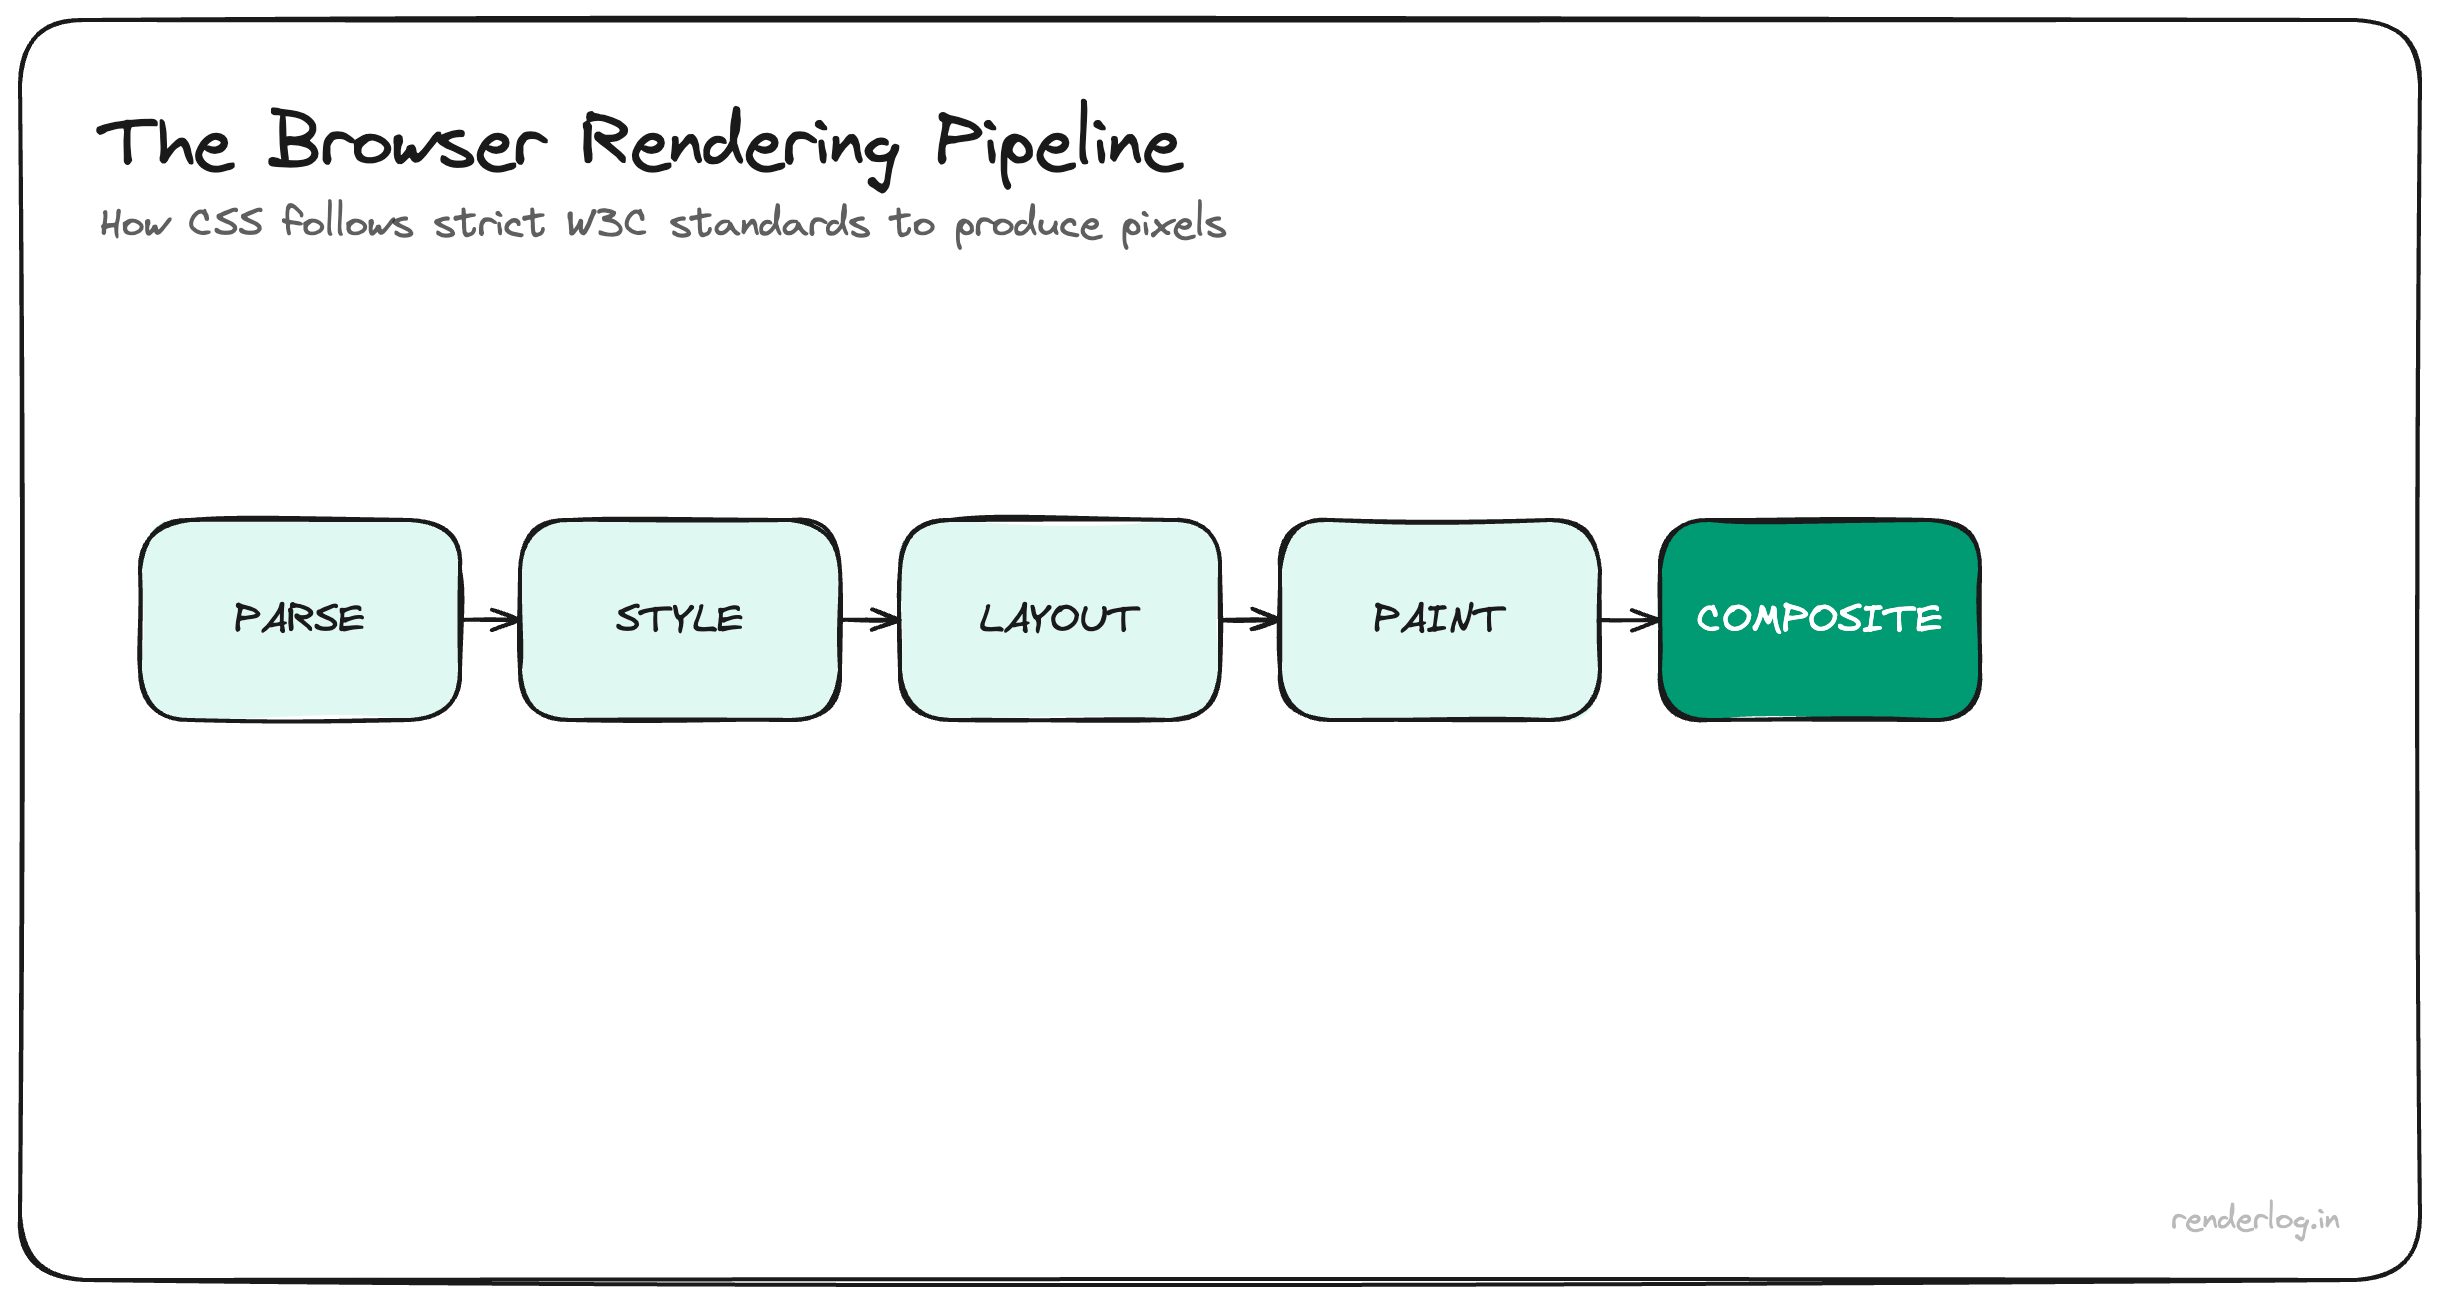
Every rendered frame runs through a fixed pipeline: Parse → Style → Layout → Paint → Composite. Understanding which stage runs on which thread, what triggers each stage to re-run, and which stages can be skipped entirely is the mechanical foundation behind every browser performance optimization.
What this covers: The full pipeline stage by stage, how the compositor thread separates from the main thread, what “jank” physically is at the hardware level, and how to read the DevTools flame chart to pinpoint which stage is your bottleneck.
The pipeline, stage by stage
When the browser receives HTML bytes, it doesn’t hand them to a rendering function and wait. It runs a multi-stage pipeline, and each stage has a different cost profile and different triggers for re-running. Understanding the stages is the prerequisite for understanding why your specific change makes something slow.
Parse HTML → DOM tree
The HTML parser converts raw bytes into a tree of DOM nodes. The parser is incremental; it doesn’t wait for the full document. As it encounters <script> tags it may pause, execute the script synchronously (if not async or defer), then resume.
The DOM is not the visual page. It’s a tree of objects representing content and structure. Style is a separate concern.
Fetch CSS → CSSOM
While the HTML parser runs, any <link rel="stylesheet"> causes the browser to fetch the CSS. The CSSOM (CSS Object Model) is built in parallel: a tree of rules, specificity-resolved, cascade-computed. The CSSOM blocks rendering the browser will not paint anything until it has enough CSS to avoid a flash of unstyled content.
This is why render-blocking CSS matters for First Contentful Paint: the larger and more complex your CSS, the later the browser can actually start putting pixels on screen.
Merge → Render Tree
The render tree is a merger of the DOM and CSSOM. Crucially, it contains only visible nodes. Elements with display: none are absent. Elements with visibility: hidden are present (they take up space). Pseudo-elements like ::before are included even though they don’t exist in the DOM.
This step is relatively cheap, but it happens whenever structural DOM or CSS changes occur.
Layout (Reflow)
Layout (also called reflow) is where the browser figures out the geometry of every element: position, width, height, margin, how text wraps. This is expensive because the layout of one element can cascade. Changing the width of a parent can reflow every child.
Layout is the most painful stage to trigger unnecessarily. It runs on the main thread and can take tens of milliseconds on a complex page.
Paint
Paint is where the browser fills in the actual pixels for each element’s visual appearance: colors, borders, shadows, text. Paint produces display lists a set of drawing instructions that are then handed to the GPU.
Not all property changes trigger paint. Properties like transform and opacity can be handled without repainting.
Composite
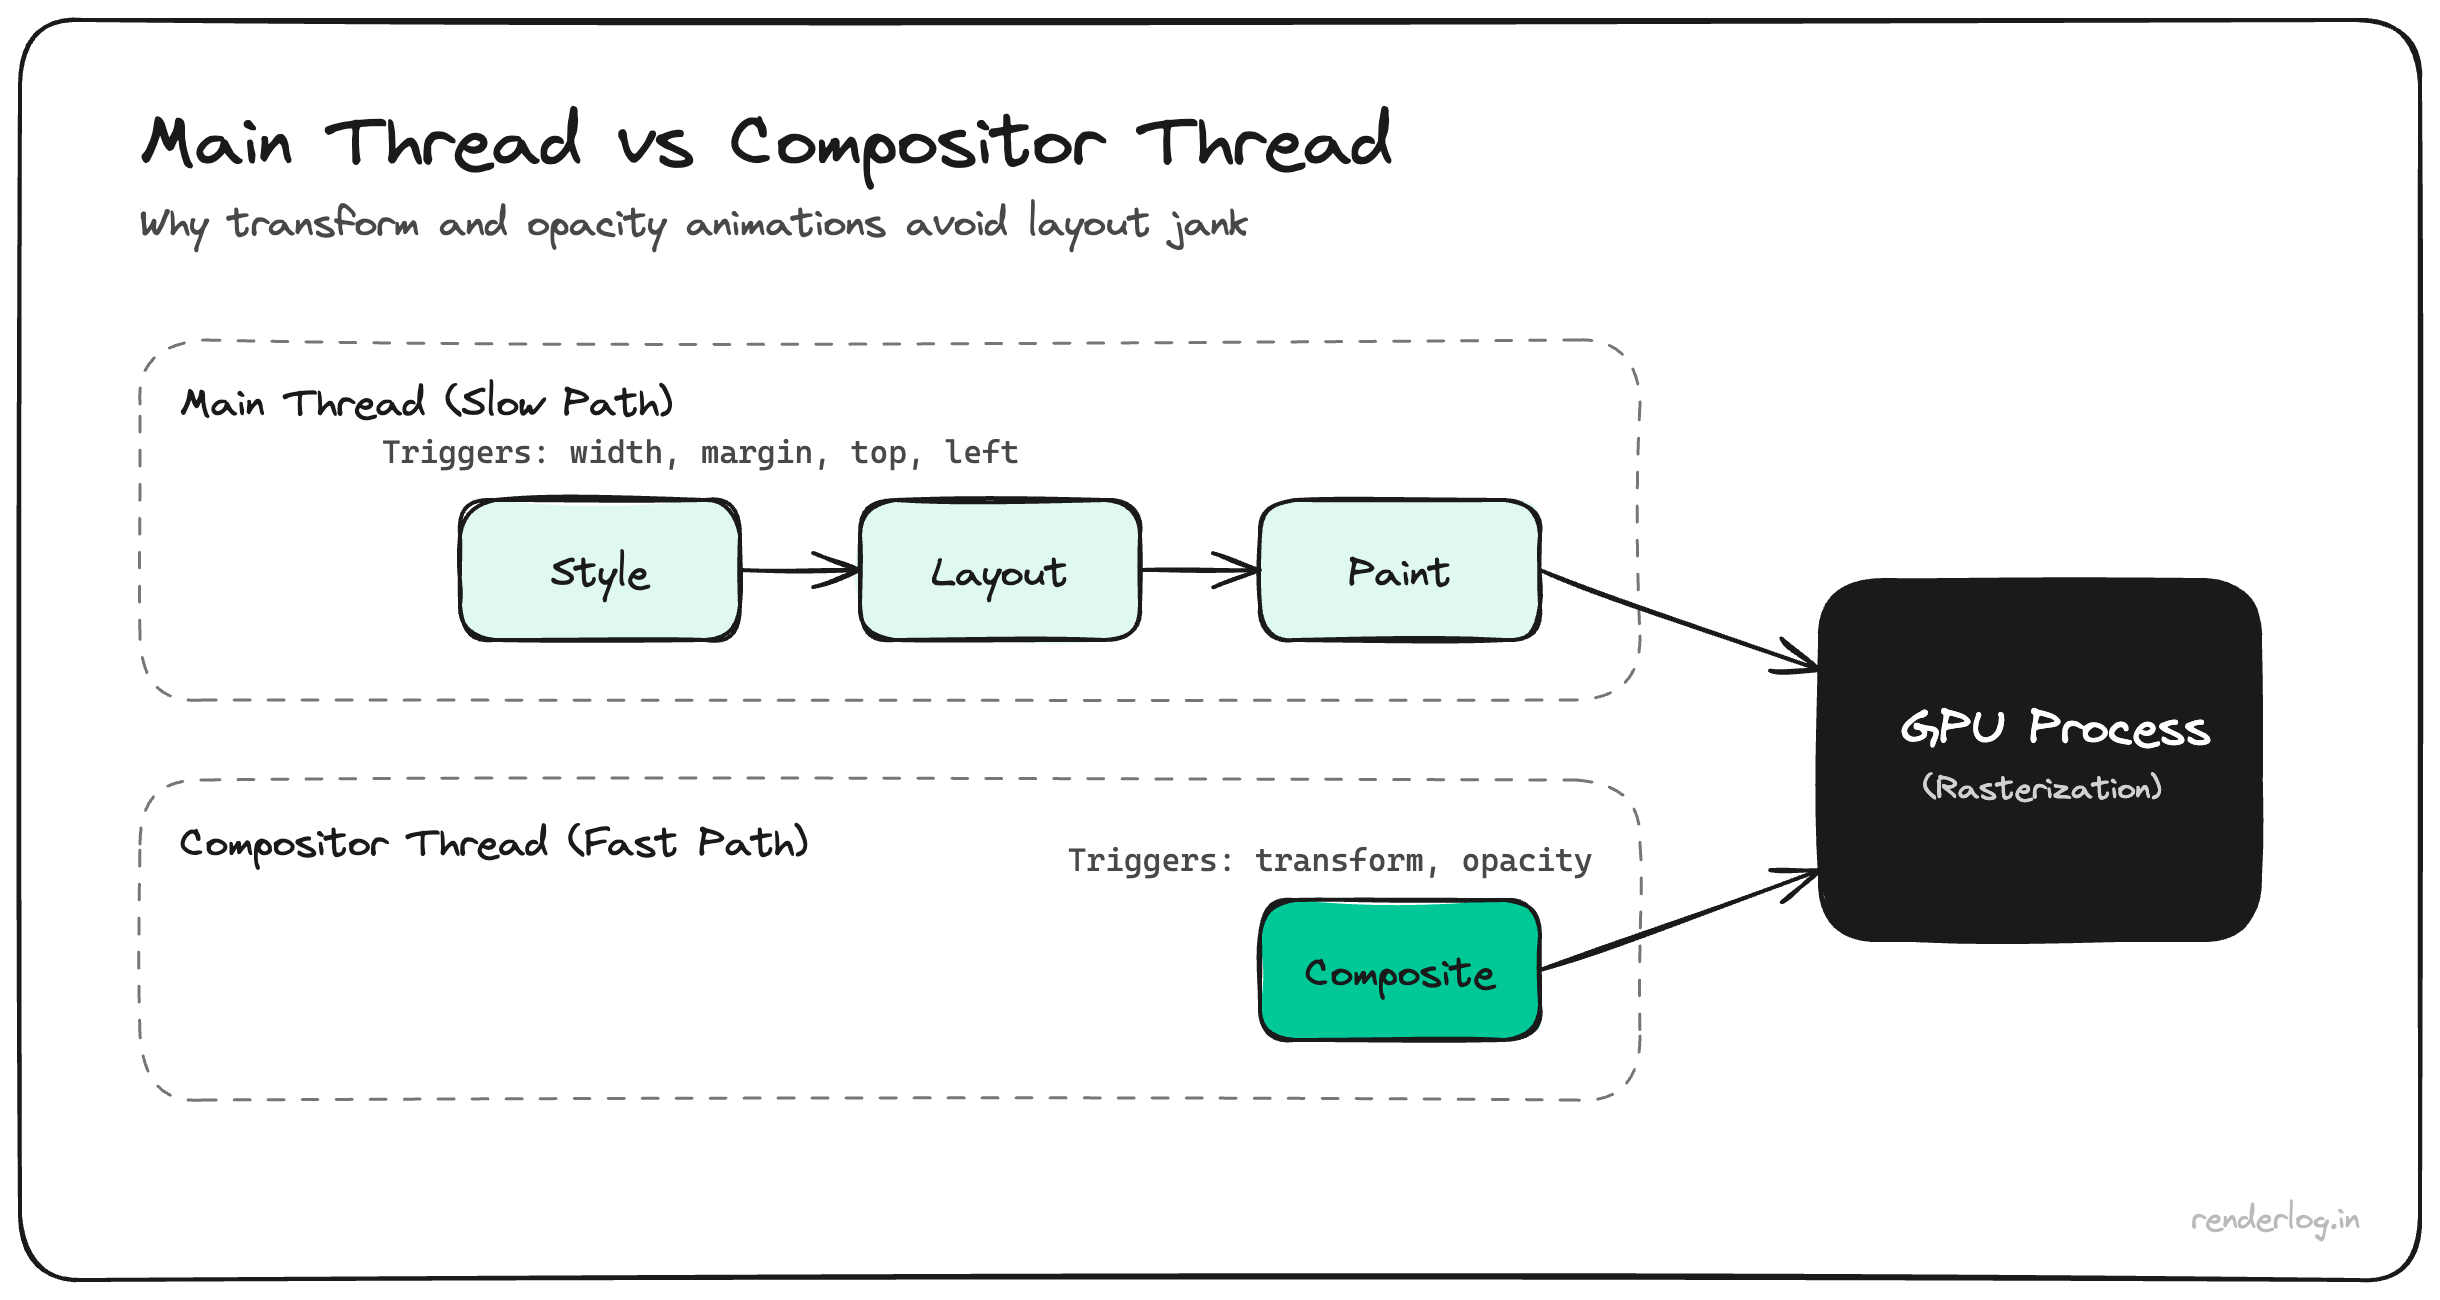
Compositing is where the browser takes individual layers (more on those below) and combines them into the final image. This step happens on the compositor thread, separate from the main thread. This is the key insight behind why transform and opacity animations are “free”: they only require compositing, not layout or paint.
Main thread vs compositor thread vs GPU process
Chrome has a multi-process architecture. The rendering work is split across at least three distinct actors.
| Thread/Process | Responsibility |
|---|---|
| Main thread | JavaScript execution, style calculation, layout, paint display-list generation |
| Compositor thread | Handles scroll, transform/opacity animations, layer compositing, independently of the main thread |
| GPU process | Rasterizes layer display lists into actual pixels on the GPU |
The practical implication: the compositor thread can keep animations and scrolling smooth even when the main thread is busy. But only if those animations involve properties that don’t require the main thread transform and opacity. If your animation touches width, top, padding, or margin, it forces the main thread back into the loop.
This is why you can see silky-smooth parallax scroll effects on a page that’s simultaneously doing heavy JavaScript work, as long as the scroll transform is isolated to its own compositor layer.
What “jank” physically is
Jank is a frame drop. The display has a fixed refresh rate, commonly 60Hz, meaning it redraws 16.67ms. At each refresh, it either shows a new frame or repeats the previous one. If the browser misses the deadline, you see a repeated frame.
This is called missing a v-sync. The human visual system is highly tuned to smooth motion. A single dropped frame is barely perceptible. Two or three in a row is “stuttery.” A consistent pattern of drops, caused by main-thread work exceeding 16ms, reads as a sluggish, broken UI even if the rest of the page is perfectly fine.
The timeline looks like this in DevTools: frames that take longer than ~16ms appear highlighted in red in the frame timeline. The Performance panel’s frame section will show you each frame’s actual duration; anything over 16ms is a potential jank source.
requestAnimationFrame and the pipeline
requestAnimationFrame (rAF) is the browser’s invitation to do visual work at the right moment. When you call requestAnimationFrame(callback), the browser schedules your callback to run at the start of the next frame, just before layout and paint.
function updateAnimations(timestamp) {
  // This runs before layout and paint, inside the frame budget
  element.style.transform = `translateX(${calculatePosition(timestamp)}px)`;
  requestAnimationFrame(updateAnimations);
}

requestAnimationFrame(updateAnimations);
What rAF does not do: it doesn’t guarantee your callback will fit inside 16ms. It just ensures you’re called at a frame boundary instead of some arbitrary async point. If your rAF callback takes 30ms, you’ve still dropped a frame. The discipline of the 16ms budget is yours to maintain.
Also important: rAF callbacks are batched to the display’s refresh rate. If you call requestAnimationFrame 500 times per second, you won’t get 500 callbacks. You’ll get approximately 60.
Forced reflow / layout thrashing
Layout thrashing is one of the most common and painful performance antipatterns. It happens when you write to the DOM and then read a layout-dependent property before the browser has had a chance to batch those updates.
The browser is lazy about layout; it tries to defer it as long as possible. But certain property reads force it to run layout immediately, because the value isn’t valid until geometry is computed. These are called forced synchronous layouts or forced reflows.
Properties that force layout when read include: offsetWidth, offsetHeight, offsetTop, offsetLeft, clientWidth, clientHeight, scrollHeight, scrollTop, getBoundingClientRect(), getComputedStyle().
Here’s what the bad pattern looks like:
// Layout thrashing  triggers layout on every iteration
const elements = document.querySelectorAll('.card');
elements.forEach(el => {
  const height = el.offsetHeight; // FORCES layout to compute
  el.style.height = (height + 10) + 'px'; // Invalidates layout
  // Next iteration reads offsetHeight again  forces layout AGAIN
});
The fix is to batch reads, then batch writes:
// Reads first: layout computed once
const heights = Array.from(elements).map(el => el.offsetHeight);

// Writes second: no interleaved forced layouts
heights.forEach((height, i) => {
  elements[i].style.height = (height + 10) + 'px';
});
In the bad version, if you have 100 elements, you’re triggering 100 separate synchronous layouts. In the fixed version, you get one. This is the difference between a 2ms operation and a 200ms one.
Compositor layers: what promotes an element
Not all elements are on the same compositor layer. By default, most content lives on a single layer. But some properties cause the browser to promote an element to its own compositor layer meaning it gets its own GPU texture and can be transformed independently without touching the rest of the page.
Properties that promote to a new layer:
| Property/Condition | Why it promotes |
|---|---|
transform: translateZ(0) or translate3d(0,0,0) | Forces GPU rasterization, historical “hack” |
will-change: transform or will-change: opacity | Explicit hint to browser to promote |
position: fixed | Must be composited independently from scroll |
<video>, <canvas>, <iframe> | Native GPU-accelerated content |
CSS 3D transforms (rotateX, rotateY) | Requires 3D compositing |
Elements with opacity < 1 that also have children | Blending requirements |
Why promotion matters: once an element is on its own layer, you can animate its transform and opacity without triggering layout or paint on the main thread. The compositor thread handles it entirely. This is how you get 60fps animations even on pages with heavy JS.
The trap: don’t promote everything. Each layer is a GPU texture that consumes memory. Promoting hundreds of elements can exhaust GPU memory (especially on mobile) and cause the browser to swap textures in and out, which is slower than not promoting in the first place.
/* Good: targeted promotion for things you know you'll animate */
.animated-card {
  will-change: transform;
}

/* Bad: promoting everything hoping for magic */
* {
  transform: translateZ(0); /* Please don't */
}
Style invalidation
When you change a CSS class, the browser needs to figure out which elements are affected and recalculate their computed styles. This is style invalidation, and it can be wider than you expect.
If you add a class to the <body>, styles that use descendant selectors (.theme-dark .card, body.loading button) could match or unmatch for any element in the tree. The browser must re-match selectors across the entire DOM.
Specificity aside, there are practical rules that make style invalidation cheaper:
- Avoid deep descendant selectors like
div > ul > li > span.textthe browser has to walk the tree to resolve them. - Use BEM or similar so selectors are flat and high-specificity matches happen quickly.
- Batch class changes adding
classList.add('a', 'b', 'c')in one call is cheaper than three separate.add()calls because it can trigger a single style recalculation.
The Performance panel’s Style & Layout section shows you “Recalculate Style” events. If you see them firing on every scroll or input event, that’s style invalidation you can reduce.
Paint vs Composite: why opacity and transform are “free”
This is the most important practical takeaway from the pipeline. The question “which CSS property is cheap to animate?” has a precise answer based on which pipeline stages the property affects.
| Property | Layout | Paint | Composite |
|---|---|---|---|
width, height, padding, margin | Yes | Yes | Yes |
color, background-color, box-shadow | No | Yes | Yes |
transform, opacity | No | No | Yes |
Properties in the third row skip layout and paint entirely. The compositor thread handles them without touching the main thread. This is why transform: translateX() is categorically different from left: when it comes to animation performance, even though they produce visually identical results.
/* Slow: triggers layout and paint on every frame */
.bad-animation {
  animation: slide-left 300ms ease;
}
@keyframes slide-left {
  from { left: 0; }
  to { left: -100%; }
}

/* Fast: compositor-only, main thread not involved */
.good-animation {
  animation: slide-transform 300ms ease;
}
@keyframes slide-transform {
  from { transform: translateX(0); }
  to { transform: translateX(-100%); }
}
Reading the DevTools Performance flame chart
The Performance panel in Chrome DevTools is the tool for diagnosing rendering bottlenecks. Here’s how to read it:
Record a trace: open DevTools, go to Performance, hit Record, reproduce the sluggish interaction, stop recording.
The frame timeline at top: a series of bars representing each rendered frame. Green bars are on-time frames. Red-outlined bars are long frames (janky). Hover to see the exact duration.
The main thread flame chart: this shows all work done on the main thread over time. The width of each block is how long it took. Blocks are stacked when one function calls another. You’re looking for:
- Wide yellow blocks: JavaScript execution. Find long-running functions.
- Wide purple blocks: Layout (Recalculate Style + Layout). Look for what triggered them.
- Wide green blocks: Paint events. Large paint areas.
- Red triangles: “Long task” markers, meaning the browser flagged a task over 50ms.
Clicking a Layout block will show you in the bottom panel which specific property read caused a forced synchronous layout. This is how I found that offsetHeight call in the scroll listener Chrome directly reported the call stack that triggered the forced layout.
The Layers panel: under the three-dot menu → More tools → Layers. Shows you a 3D view of your compositor layers. Useful for checking if you’re accidentally promoting hundreds of elements.
Practical triggers for each pipeline stage
A quick reference for what causes the browser to run each stage:
| Stage | Common triggers |
|---|---|
| Style | Adding/removing CSS classes, inline style changes, pseudo-class changes (:hover) |
| Layout | Any geometry change (width, height, margin), reading forced-layout properties, font loading |
| Paint | Color changes, shadow changes, visibility changes, border-radius, clip-path |
| Composite | transform, opacity, scroll position (on promoted elements) |
When you’re debugging a performance problem, identifying which stage is the bottleneck tells you exactly where to look. A long “Recalculate Style” event points to selector complexity or broad invalidation. A long “Layout” event points to geometry-changing properties or forced reflows. A long “Paint” event points to large paint areas or expensive paint operations like box-shadow and filter.
The rendering pipeline is not a black box. Every frame of jank has a cause, and it’s visible in the flame chart if you know where to look.