Related: Why CSS Never Matches Figma which is another place where the browser’s rendering pipeline creates unexpected gaps.
At 60Hz, the browser has ~16.67ms per frame for all JavaScript execution, style calculation, layout, paint, and compositing — combined. This is not a soft guideline. It is a hard physical constraint set by the display’s refresh schedule. Miss the deadline and the display repeats the previous frame. Miss it consistently and users perceive jank regardless of what Lighthouse reports.
What this covers: Where the 16.6ms number comes from, what work must fit inside one frame, why good Lighthouse scores coexist with bad runtime performance, and why high-frequency data UIs are the most unforgiving stress test for this budget.
Where 16.6 ms comes from
A 60 Hz panel asks for 60 frames per second. One second divided by 60 is ≈16.67 ms per frameoften rounded to 16.6 ms in conversation.
That number is not a browser setting; it is physics of the refresh schedule. If the main thread and compositor together cannot produce a new frame in time, the display repeats the previous one: you have dropped a frame. Enough drops in a row read as jank, stutter, or “laggy” UI, even when First Contentful Paint and Time to Interactive look fine on a cold load.
What must fit inside one frame
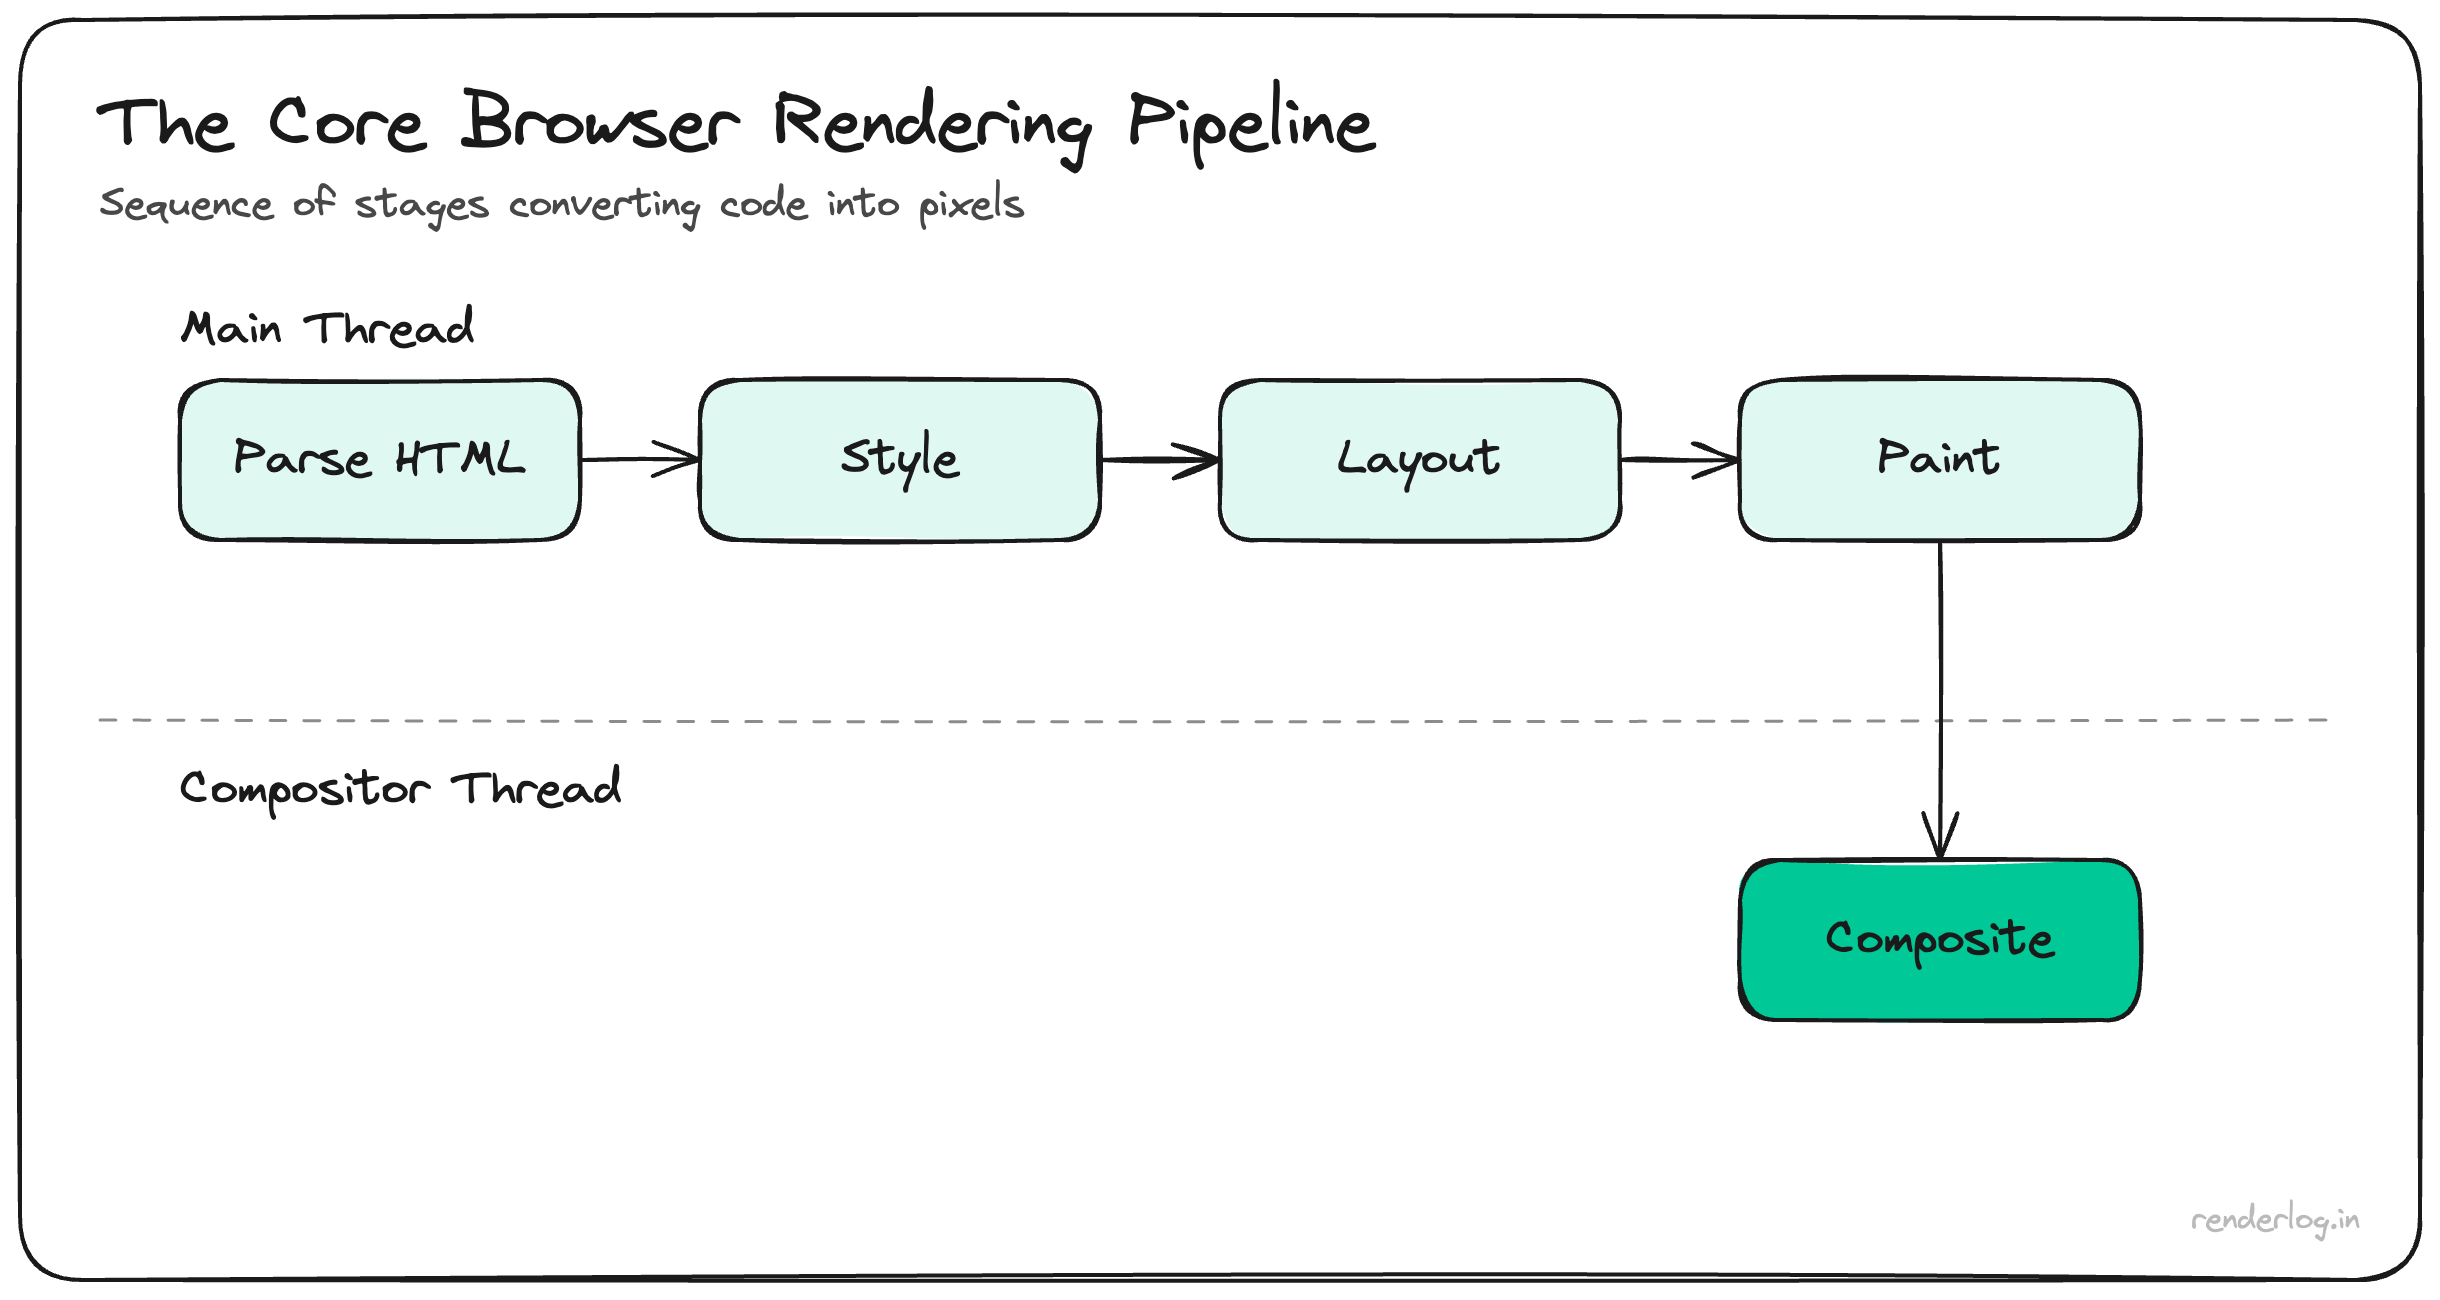
On the main thread, a heavy tick might include:
- JavaScript: event handlers, your React reconciler, data transforms, garbage collection spikes.
- Style: matching selectors and computing layout-affecting properties.
- Layout: calculating geometry when something actually moves or sizes (cheap property changes can skip this; wide invalidations cannot).
- Paint: rasterizing layers; some effects force more work than others.
The compositor then assembles layers for the GPU. Work that stays compositor-only (for example, many transform and opacity animations) is how sites keep motion smoothbut parsing a giant JSON tick, rebuilding a chart, or mounting hundreds of rows still tends to touch JS + layout + paint first.
Takeaway: the 16.6 ms budget is a ceiling for all of that, not “JavaScript time” alone.
Why good Lighthouse scores can hide the problem
Lighthouse and similar audits focus heavily on load and lab conditions: bundle size, critical path, caching, LCP, CLS in synthetic runs. They are invaluable for shipping fast first paint.
They are easy to misread as “performance is solved” because runtime pain shows up when:
- WebSocket or SSE pushes dozens of updates per second.
- Each update triggers state changes that re-render large subtrees.
- Charts reconcile thousands of points on the main thread.
- The user scrolls or zooms while new ticks land.
That is exactly the shape of a trading or operations dashboard: high-frequency mutations plus dense UI. Load metrics stay green; frame time spikes in production.
Real-time data and the main thread
When every tick runs through React setState (or store writes that fan out to hooks), you pay pure JS and often layout. If a single burst exceeds ~16.6 ms, you miss the next v-sync. Miss often enough and users perceive drag even if CPU usage “looks low” averaged over a second.
Patterns that help stay inside the budget (none are magic; all need measurement):
| Idea | Role |
|---|---|
| Throttle / batch updates | Collapse 50 ticks into one RAF-aligned commit per frame. |
| Isolate subscriptions | Keep fine-grained listeners so unrelated panels do not re-render. |
| Virtualize lists | Render viewport rows only for order books and tape-style feeds. |
| Move work off-thread | Web Workers or WASM for parsing and aggregation; ship snapshots to UI. |
| Prefer cheap motion | Animate transform/opacity; avoid layout-thrashing read/write loops. |
Profiling beats guessing: Performance panel in Chrome, React Profiler, and Long Task marks tell you whether you are fighting JS, layout, or paint.
Mental model checklist
- 60 Hz ⇒ ~16.6 ms per opportunity to show a new frame; there is no secret “extra time.”
- Fast load ≠ smooth runtime; streaming UIs punish per-tick cost on the main thread.
- Dashboards and trading surfaces are stress tests Optimize them like games: budget, batch, measure.
Runtime performance is not a different hobby from web performance; it is the same discipline applied after the first paint. Once you internalize the frame budget, “why does this feel slow?” stops being mysterious and becomes a timeline question.